
Project evaluation must consider project risk. Water yields vary with hydrologic and regulatory conditions. Project construction and operations face potential pitfalls. Will a 100-year flood or earthquake impair/destroy facilities? Prices of project outputs and inputs are variable. Will run-up in energy prices or decline in water demands from a weak economy threaten project viability? The list of project risks is long.
A common practice adjusts the interest rate used in project evaluation to reflect an extra return to compensate for project risks. This third post in the series on Project Evaluation looks at market data on risk premiums, finding that water projects may look like an investment in corporate bonds. However, how does one know which type of corporate bond a project is most comparable: highly rated, low-rated, or junk bonds? Project risks should be considered and quantified explicitly, not buried in interest rate assumptions.
Market Risk Premiums
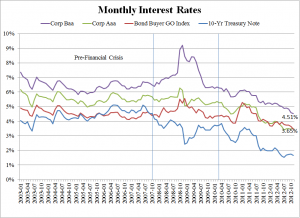
Consider the yield for the benchmark security discussed last week, 10-Year Treasury Notes relative to municipal bonds (the Bond Buyer General Obligation Index) and corporate bond (for Aaa rated and Baa rated). Prior to the financial crisis, the trend in these interest rates were stable (see chart). Municipal general obligations bonds paid a small risk premium over treasury notes, 0.12% (or 12 basis points—1/100th of a percent, see table below). Higher rated corporate bonds, Aaa, paid a higher risk premium 1.13% (113 basis points). Lower rated corporate bonds, Baa paid an even higher risk premium, 2.03% (203 basis points).
Risk Premium for Municipal and Corporate Bonds
(2003-2012)
|
Time Period |
Bond Buyer G.O. Bond Index |
Corporate Aaa Bond |
Corporate Baa Bond |
| Pre 2007-10 |
0.12% |
1.13% |
2.03% |
| 2007-10 to 2009-12 |
1.16% |
1.93% |
3.73% |
| Post 2010-1 |
1.57% |
1.81% |
2.95% |
| Increase (Post – Pre) |
1.45% |
0.69% |
0.92% |
Note: Risk premium = interest rate for security – yield on 10-Year Treasury Note. Data from Federal Reserve Board of Governors
Risk premiums jumped during the height of the financial crisis (which I define starting in October 2007 when problems at Bear Stearns became public through 2009). The risk premium for municipal debt increased by 104 basis points, for Aaa corporate debt by 80 basis points (from 1.14% to 1.93%) and for Baa corporate debt by 170 basis points (from 2.03% to 3.73%).
After 2009, as the yield on 10-Year Treasury notes started declining steadily due to a free-fall in the real interest rate (see last week’s post), the risk premium on municipal debt increased while risk premiums for corporate debt fell. Since the start of the financial crisis, the risk premium on municipal debt has increased by more than the risk premiums for corporate debt (for both Aaa rated and Baa rated).
Today, the yield on the Bond Buyer General Obligation Index is indistinguishable from the yield on Aaa corporate bonds. For municipal revenue bonds, whose yields are higher than yields of general obligation bonds, they are approaching the yield of corporate bonds. Last December, for example, the San Diego County Water Authority secured tax-exempt financing for the Carlsbad Desalination project at 4.78%. The yield on Baa corporate bonds stood at 4.51%.
Interest Rates for Project Evaluation
Water projects generally secure project financing where project revenues pay financial obligations. Therefore, comparing how project risks compare with risks of corporate securities is one way to think about the risk premium. Therefore, if one thinks a project’s risk is like Aaa-rated or Baa-rated corporate bond, then use the risk premium for those corporate bonds. As explained in last week’s post, a reasonable interest rate assumption for the yield on 10-Year Treasury notes is 4.5% for the purpose of project evaluation. Therefore, use an interest rate of 6.31% (4.5% + 1.81%) for projects judged like an Aaa rated corporate bond, or an interest rate of 7.45% (4.5% + 2.95%) for projects judged like a Baa rate corporate bond.
The challenge, of course, is determining the comparable corporate bond for a specific water project.
Another approach would look at project risk directly and quantify an estimate of the required risk premium. I illustrate the approach with a simple example.
Suppose one issued a $1,000 bond with a term of 20 years. Assume the yield on the 10-year Treasury Note is 4.5%. If there were no risk in purchasing the bond, the bond could be sold at par in the marketplace at a yield of 4.5%.
Assume that an examination of the bond’s risk concluded that there is a 1% chance that the bond will default in any year. To keep the example simple, suppose that if there is a default, there is no recovery of any remaining interest payments and principal. To compensate investors, the bond issuer must promise to pay a higher coupon rate than 4.5%. How much?
The answer is 5.56%. This is the calculated coupon rate that will yield an expected cash flow of coupon payments and principal with a present value of $1,000 at the risk-free interest rate of 4.5%. The interest rate (‘i”) reflects the risk-free rate (“r”) and the annual default risk (“d”) as follows:
i = (r + d)/(1-d) = 4.5% + 1.0% (100% – 1.0%) 5.56% (rounded), or
i = r/(1-d) + d/(1-d)
Using the second formulation, the interest rate equals the risk free rate (r) adjusted by the probability of non-default, (1-d), plus the relative odds of default to non-default (d/1-d)).
Quantitative risk assessment is a relatively new discipline but represents a framework for examining the implications of one’s beliefs about risk. Another way would be to turn around the exercise. For the above example, what is the implied risk of default for different risk premiums? The risk premium is very close to the annual probability of default (see table below).
Risk Premium, Default Probability, Expected Time to Default
|
Risk Premium |
Default Probability |
Expected Time to Default |
|
1% |
0.9% |
106 |
|
2% |
1.9% |
53 |
|
3% |
2.8% |
36 |
|
4% |
3.7% |
27 |
|
5% |
4.6% |
22 |
|
6% |
5.4% |
18 |
The last column shows the expected time to default implied by the risk premium. I find this column useful when thinking about risk premiums. Someone who advocates a risk premium of more than 3% is implying that the expected time to failure is less than 30 years. Putting this within the context of water projects, use of risk premiums above 2% implies anticipated project failure within a few decades. In other words, for projects with anticipated long lives, a risk premium closer to an Aaa-rated corporate bond than a Baa-rated corporate bond is appropriate.
Takeaways
The simple example illustrates that there are two ways to do project evaluation. One approach projects cash flows of the project and select a risk premium consistent with one’s beliefs about project risks. This approach is akin to the discussion of the risk premium in the above example.
The other approach would be to specify project risks expressly and estimate expected cash flows consistent with one’s beliefs about project risks. This approach is akin to modeling default risk in the above example. The present value of expected cash flows using the risk free interest rate provides a correct valuation of the project. (This is the certainty-equivalement method in corporate finance, where no further need to adjust for risk provided that the financial risk of cash flows is fully diversifiable.)
Based on my experience, there is confusion about the latter alternative. Project risk is reflected in the calculation of expected cash flow by incorporating the consequences of project risks. In terms of the above example, incorporate the risk of default directly into the valuation of expected bond payments.
Explicit consideration of project risks has many advantages. First, rather than arguing by analogy to select a risk premium, the analyst focuses directly on project risk.
Second, identification of project risks can feed into risk management of the project. How many project evaluations either includes input from risk managers or provide information useful for risk managers? Few, if any. As a result, the cost of insurance, hedging, financial reserves, and what other tools that will be used in practice may be excluded from the evaluation.
Third, an inventory of project risks should prove useful for negotiating risk allocation provisions included in construction and operating agreements.
Finally, identifying project risks and management strategies will support project financing. Cheaper financing should reward improved and accurate disclosure of well-managed projects.
Pingback: Project Evaluation IV: Time Horizon | Water Strategist Community Blog