
One answer, who knows check back in April after Mother Nature speaks. But, that is not helpful for planning. Another approach, study the historic record of final SWP allocations. The final SWP Allocation is expected to be 12%, with one-third chance that the final SWP allocation will be below the initial 5% allocation announced last November.
Historical Record for SWP Allocations
The history of SWP allocations has three distinct time periods (see history chart). Between 1968 through 1989, SWP allocations averaged more than 90%. Spurred by the 1991 drought, SWP allocations dropped and averaged 74% through the 1990s. There was a brief recovery in SWP allocations, increasing by 10 percentage points until the early 2000s. Since then, average SWP allocations have been declining.
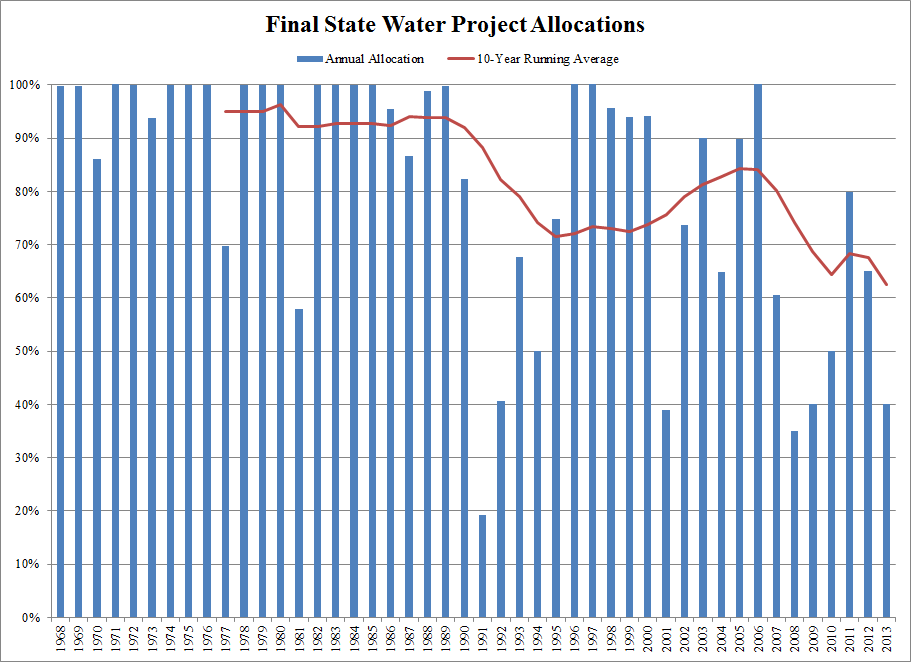
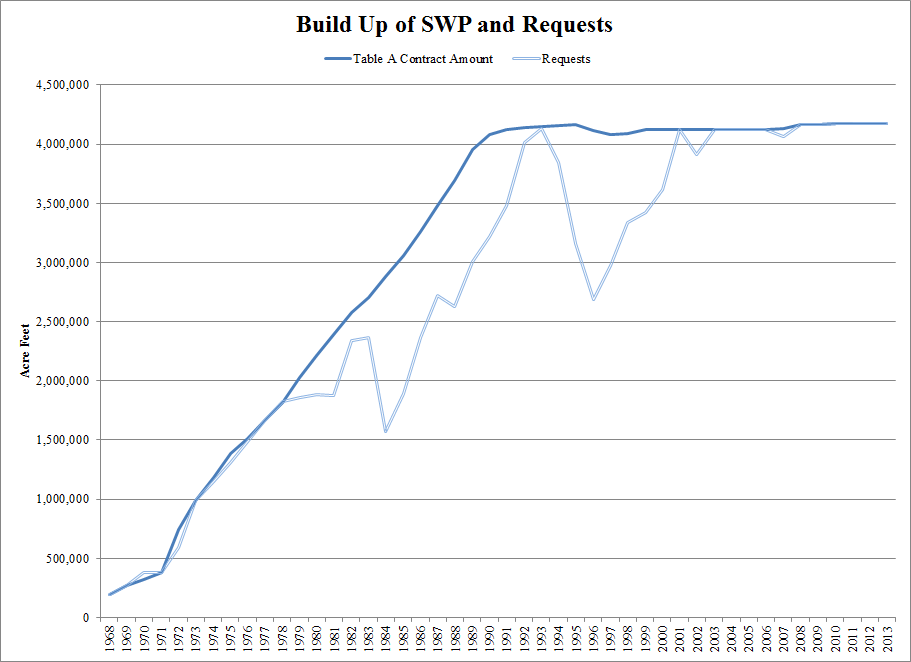
The period of 90%+ SWP Allocations corresponded to the scheduled build-up of the SWP (see build up chart). SWP Contract Amounts grew until 1990. Therefore, the relevant historical period for thinking about SWP Allocations going forward is the post-1989 record. After the Monterrey Amendments to SWP contracts, SWP contractors now request their full contract amount each year.
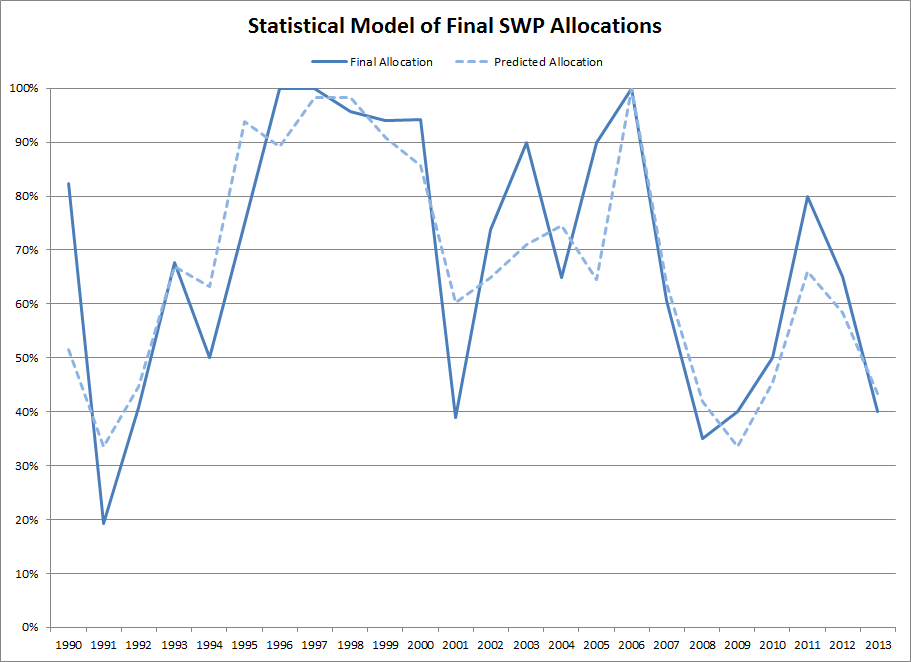
Department of Water Resources looks at a variety of factors in setting SWP Allocations. Two key factors is the amount of water in storage at Oroville at the beginning of the water year (October 1) and forecasted and actual precipitation and runoff. Hydrowonk conducted a statistical analysis of Final SWP Allocations between 1990 and 2013. The resulting model predicts about three-fourths of the annual variation in Final SWP Allocations (see model chart). As expected, the Final SWP Allocation is greater, the more water in storage at Oroville at the beginning of the water year and the greater the actual amount of precipitation in the Sacramento Index in October through April of the water year. There was also a modest increasing trend in Final SWP Allocations of 0.8 of a percentage point per year from 1990 through 2002, that was reversed in 2003, Since then, the expected Final SWP Allocation is declining by 2.5 percentage points per year.
Predictions for 2014
Storage in Oroville stood at 1,633,286 AF at the beginning of the water year, only about 400,000 AF below the 1990-2013 average (2,030,963 AF) and about 540,000 AF above the minimum amount of water in storage at the start of the water year (2008-2009 when the SWP Allocation was 40%). The problem, of course, is low precipitation. For the first three months of this water year, actual precipitation has been only 17% of the average for 1990-2013. Assuming that the remaining months will average only 17% of average, precipitation will remain low despite the variability in monthly precipitation in the historical record.
Cumulative Precipitation for Water Year 2013-2014
(Inches)
|
Oct |
Nov |
Dec |
Jan |
Feb |
Mar |
Apr |
|
|
80 Percentile |
5.54 |
8.73 |
10.55 |
12.15 |
|||
|
Actual/Projected |
0.8 |
2.4 |
3.2 |
4.69 |
6.86 |
8.01 |
9.20 |
|
20 Percentile |
3.61 |
4.59 |
5.13 |
5.89 |
|||
|
1990-2013 Ave |
2.93 |
8.33 |
18.52 |
27.48 |
36.03 |
43.63 |
47.81 |
Projected in blue
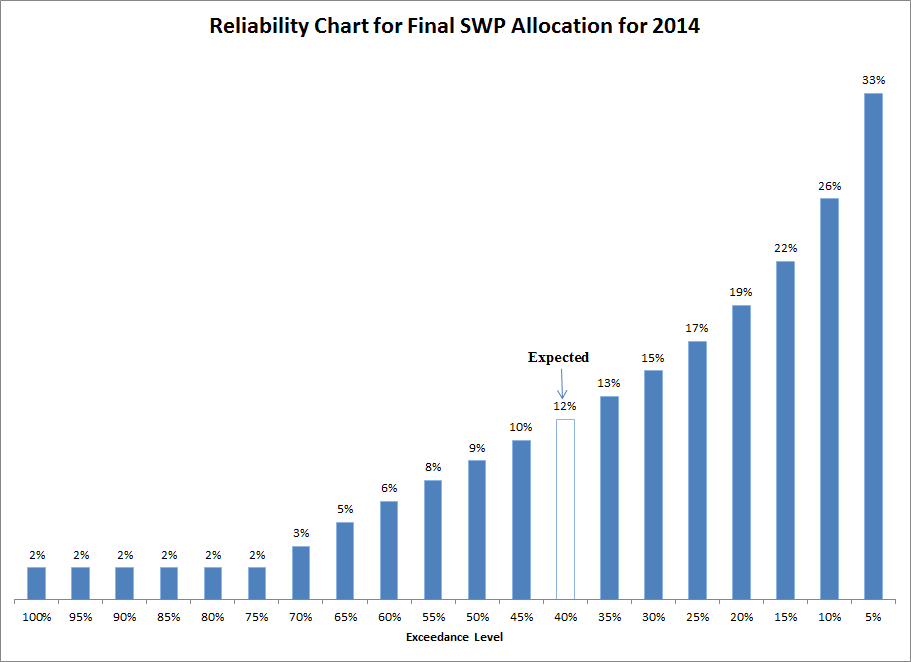
Given the variability in precipitation and the statistical model for Final SWP Allocations, the expected Final SWP Allocation for 2014 is 12%. (The analysis placed a 2% minimum SWP Allocation, which would be only 83,000 AF of SWP water allocated.) The likelihood that the Final SWP Allocation will exceed 12% is small (see reliability chart). There is a one-third chance that the final SWP Allocation will be less than the 5% Allocation announced last November. An allocation of greater than 19% has only a one-in-five chance.
Mother Nature will not bail out California. In the 1991 drought, the Final SWP Allocation was 19% when there was a “March Miracle.” The odds are not good for a repeat of 1991. 2014 will be significantly worse. The Final SWP allocation will be about one-third 1991’s Final SWP Allocation. As noted in this Monday’s Wall Street Journal editorial, “the chickens have come home to roost” after decades of gridlock in California.