
California’s State Water Project is the backbone of the California economy. The recent declaration of a zero water allocation for 2014 has exposed the California economy’s vulnerability to decades of political gridlock and ineffective water agency action. Last Friday’s announced allocations for the federal Central Valley Project piled on. Unless changes are made promptly to California’s “water culture”, look for California growth to come to a screeching halt. To quote Reverend Wright (admittedly out of context), “California, the chickens have come home to roost.”
This post is the first of an eight-part series on Rethinking California’s Water Industry. In this post, I analyze the economic implications of the unreliability of the State Water Project, including the use of State Water Project (“SWP”) water for real estate development. Carryover storage capacity owned by water users and having more than five times SWP contracts needed to cover water demands are critical.
Subsequent posts will cover the critical elements of California’s new water culture:
- time to give up discussing the supply reliability of the SWP or the federal CVP (there is none) and start taking about risk management (Post 2)
- what does the zero allocation mean for the Bay Delta Conservation Plan (Post 3)
- time to discuss supply reliability in terms of total water system performance and evaluating supply sources in terms of their contribution to system performance (Post 4)
- how the water needs of real estate development involves more than a dedication of a water right, with one notable exception (Post 5)
- California’s future depends on water conservation and resource development in Mexico (Post 6)
- New perspectives on the role of groundwater (Post 7)
- Time to embrace the private sector (Post 8)
SWP Facts
Water wonks know the facts. The SWP provides water to over 25 million Californians (two-thirds of California’s population). It also provides water to over 750,000 acres of California’s most productive irrigated lands. The SWP’s infrastructure traverses the backbone of the Golden State. Look outside the window of a Southwest Airlines flight between Ontario and Sacramento and see most of this mammoth project.
The total contract amount for the State Water Project is about 4.2 million acre-feet of water. The SWP, of course, does not have enough water to meet its full contractual obligations. Instead, California’s Department of Water Resources (“DWR”) declares a percentage water allocation each year, based on the amount of water in storage in Oroville in the fall and the precipitation in the Northern Sierra.
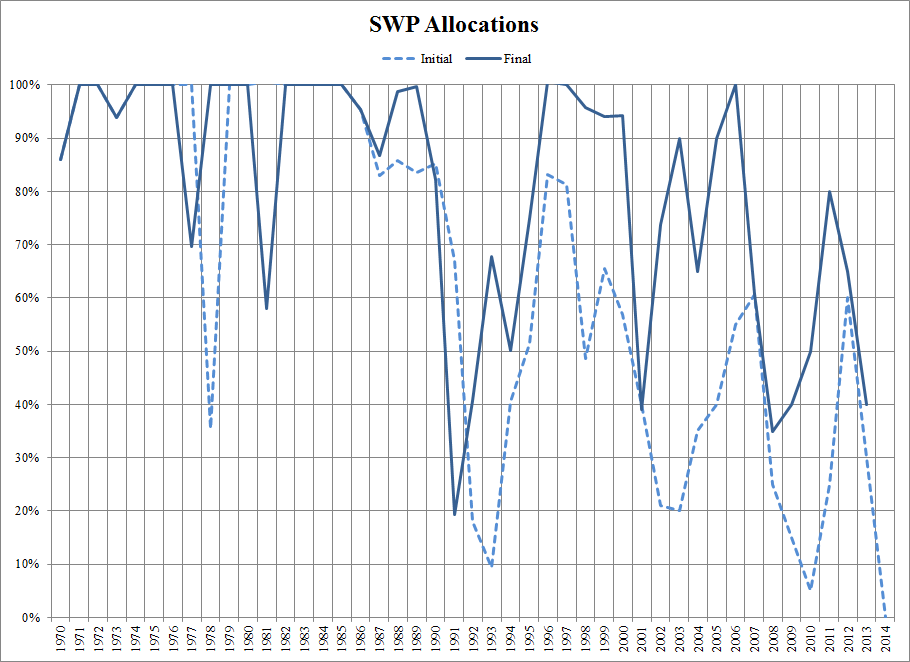
Again, water wonks know that the SWP rarely meets its contractual obligations, if ever (see chart). Until this year, the lowest SWP allocation occurred during 1991 when the final SWP allocation was 19% (DWR’s initial allocation that year was 67%). This year’s initial water allocation of zero is historically unprecedented. Hydrowonk’s model of SWP final allocation predicts that the expected final 2014 allocation will be 11%, although there is about a one-fourth chance that the final allocation remains at zero.
The reasonable prospect of a zero water allocation means that it makes no sense to discuss SWP supply reliability. Instead, it is time to consider a set of closely related questions:
- What is the economic cost of water shortages from relying on the SWP?
- How can these costs be mitigated (forget about elimination)?
- What does all this mean for the current negotiations on SWP contract renewals?
Economic Cost of Water Shortages
Hydrowonk uses the same framework the Department of Water Resources uses to analyze the economic cost of municipal water shortages avoided by the proposed Bay Delta Conservation Plan (“BDCP”). DWR has completed an updated analysis of the deliverability of the SWP project as part of its analysis of the BDCP. The table below shows the results for the existing conveyance—High Delta Outflow Scenario. Ninety-nine percent of the time, the SWP allocation will exceed 12%. About half the time, the SWP Allocation will exceed 41%. The minimum allocation is 7.2% and the maximum allocation is 91%.
SWP Water Allocation and Probability of Exceedance
|
SWP Allocation |
Probability of Exceedance |
|
12% |
99% |
|
29% |
86% |
|
34% |
74% |
|
36% |
62% |
|
41% |
49% |
|
43% |
37% |
|
48% |
25% |
|
53% |
12% |
|
91% |
0% |
Note: DWR does not publish its schedule, so I read off a chart. Therefore, the information in the above table would not exactly coincide with DWR’s analysis.
Hydrowonk developed a SWP Water Shortage Model to analyze the economic costs of relying on the SWP for a new real estate development. This example is relevant for California because many water agencies are using the SWP as a benchmark to assess the adequacy of water supplies for new real estate developments. Recognizing that the SWP contract is not fully reliable, agencies require more than one acre foot of SWP contract amount to meet an acre foot of a new development’s water demand. Generally speaking, if the average water allocation of the SWP was 60%, a developer would need 1.7 acre feet of SWP contracts (1.7 ≈ 1/.6) per acre foot of water demand.
Hydrowonk’s shortage model analyzes the expected economic costs of water shortages over a 50-year period when relying solely on the SWP. The model considers two shortage risk mitigation measures: how many contracts to hold per acre foot of water demand (“SWP Contract Coverage”) and carryover storage capacity (reservoir capacity not needed for operational purposes). The first call on available water in any year is meeting water demand. If available water exceeds demand, then store water for use in future years (subject to available unused carryover storage capacity). If available water is less than demand, withdraw water from storage. A water shortage occurs only when the amount of currently available SWP water plus water withdrawn from carryover storage is insufficient to meet water demand. The economic cost of water shortages uses DWR’s framework to estimate the economic cost of municipal water shortages.
Techno wonk alert: Expected costs of water shortages is calculated by a 10,000-iteration Monte Carlo study using the continuous form of a probability distribution based on the table above for SWP water allocations.
The expected SWP water allocation is 41.45%. Therefore, the standard practice of water agencies would mean that a new real estate development project must dedicate about 2.5 of SWP contract amounts per acre foot of water demand—actually 2.41(= 1/.4145 ) for those interested in finer precision.
Sole reliance on the SWP for a real estate development dedicating only 2.5 of SWP contract amounts per acre foot of water demand without carryover storage capacity is fool-hardy. For a 50-year project horizon, the present value of the expected economic costs of water shortages would be over $11,000/AF of water demand (see chart). To put this number in perspective, the current annual water demand in Southern California is about 4 million acre-feet. If the expected economic cost of water shortages were $11,000/AF of water demand, then the expected economic costs of water shortages in Southern California would be $44 billion. Hydrowonk doubts that shortage costs of this size would be economically or politically acceptable.
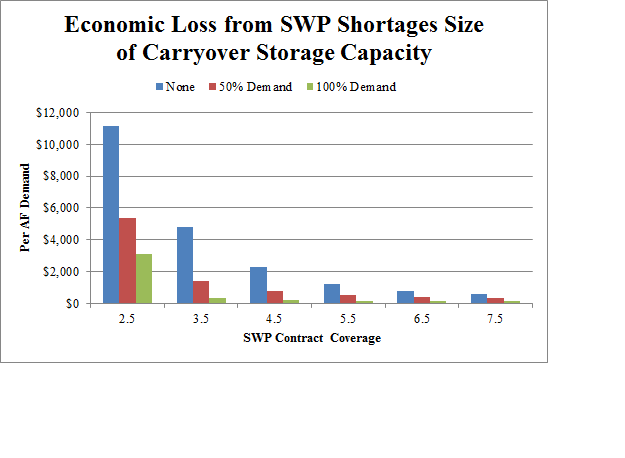
Expected water shortage costs can be reduced by greater SWP Contract Coverage and more carryover storage. Assuming that expected cost of water shortages below $600/AF of water demand were acceptable, there are different pathways:
|
SWP Contract Coverage |
7.5 |
5.0 |
3.0 |
| Carryover Storage |
none |
50% demand |
100% demand |
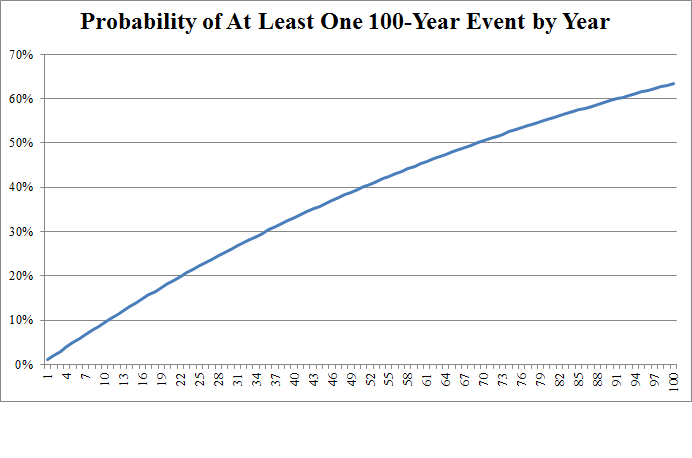
SWP Contract Coverage without carryover storage is a fool’s errand. When water allocations are zero, current year water supply is nothing regardless of the size of SWP Contract Coverage. Therefore, carryover storage is necessary to avoid catastrophic water shortages. These are low probability events, on the order of a 100-year flood (see chart).
One hundred year events periodically occur and not simply every 100 years! (see figure). There is almost a 20% chance of at least one 100-year event will occur within 20 years, 25% within 30 years, 33% chance within 40 years and 40% chance within 50 years. On the “upside”, there is only about a two-thirds chance that at least one 100-year event occurs within 100 years.
Hydrowonk doubts that the California economy can grow or even maintain itself in the face of this time profile of risks of economic catastrophe. The metric expected economic cost of water shortages masks the water supply lottery in California.
Carryover storage capacity and high SWP Contract Coverage can help avoid the 100-year catastrophes. But, there is an interesting implication of high Contract Coverage—significant unused SWP water (see chart). A 3.5 SWP Contract Coverage, unused available water (i.e., water not used to meet current water demand or placed in storage) is around 90% of annual water demand. Higher SWP Contract Coverage Ratios yield even greater volumes of unused water! Why? The SWP Contract Coverage Ratios are routinely making available more water than needed to meet water demands. While carryover storage can use some of the excess water, the run of water supplies in normal and wet years overruns storage capacity.

From an economics perspective, there are two options to put the “unused water” to work. Expand carryover capacity. However, few areas have local carryover capacity equal to annual water demands. This leads us to the second option—transfer water to a third party.
Restructure the SWP
Currently, a SWP Contract represents a pro-rata share of available SWP water. Think about sub-dividing Table A Contract amounts into two classes (named imaginatively, Class 1 and Class 2).
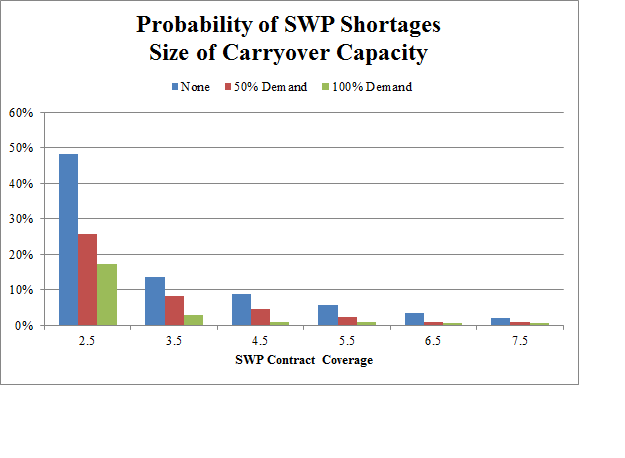
Class 1 would equal a fraction of the current Table A contract amounts. What fraction? A SWP Contract Coverage of 5.5 per AF of water demand puts expected economic costs from water shortages below $500/AF with some carryover storage and the probability of a water shortage on the order of 1% (see above charts). So, the SWP project could support water demands equal to 18.2% ( ≈ 1/5.5) of total contract amounts. So, Class 1 contract amount would represent a pro-rata claim on the first 760,000 AF of available water in any year. Class 2 contract amounts would represent a pro-rata claim on the amount of SWP water available, if any, in excess of 760,000 AF in a year.
Consider a hypothetical SWP contractor with current Table A contract amounts of 100,000 AF. This would be divided as follows: 18,200 AF Class 1, and 81,800 AF Class 2. If they simply hold these contract amounts, then the restructured SWP operates that same for them as the current SWP contract structure.
So, why create two classes? Well, Class 1 rights have senior claims to available SWP water over Class 2 rights. Water users with higher economic costs from water shortages (municipal, industrial, permanent crops) could acquire Class 1 contract amounts from water users with lower economic costs from water shortages (annual crops, etc). The transactions, of course, can involve money. Alternatively, the transactions could involve the swap of Class 1 rights for Class 2 rights. Such a transaction would make sense for water users with lower economic costs from water shortages with local water storage. The bottom line, here is that SWP water users need significant local storage. For municipal water users, for example, they can either expand local carryover storage themselves or swap Class 2 rights to agricultural water users who have existing unused storage or can expand storage at lower costs. Or, they must keep their Class 2 rights and enter into storage agreements.
Evolve or Else
While I was not in the business when the SWP was put together, the lack of reliability of SWP supplies today was probably not anticipated. The structure of SWP contracts and operations used tools suited for the circumstances anticipated. The variability of SWP supplies and the lack of reliability today challenge California’s water industry. In this “new world,”
- New Real Estate Development: a SWP Contract Coverage of 5.5 of contract amounts per AF of water demand is reasonable, not SWP Contract Coverage based on the SWP’s expected allocation (2.5).
- Dedication of SWP contracts alone won’t get the job done (need local carryover storage as well)—more on this in the fifth post in this series
- Dividing Contract A amounts into two classes provides the contractual tools to manage the inevitable paradox—SWP Contract Coverage needed to reduce the economic costs of water shortages generates significant unused water supplies. The “senior/junior” priority class structure and trading of these contracts would improve risk management of the SWP.
Status quo is not sustainable. This year’s initial allocations for the SWP and the federal Central Valley Project has revealed that the “emperor has no clothes.” So improve the risk management of these projects but accept that they are not reliable. That means expanding the scope of one’s concept of water sources for water systems. Failure to act effectively will have consequences:
- Hedge funds will start shorting California real estate development (unless firms initiate their own aggressive program to achieve water supply reliability)
- Private equity will enter to fill the gaps in today’s investment opportunities (if the movie “The Graduate “ was made today, the party scene would be discussion off water carryover storage, not plastics)
- An enterprising investment bank (or Tribe?) will create a derivatives market for the Case-Schiller real estate indices for California
Rodney – are you aware that the original SWP contracts contained a clause that allowed the contracted amount to be reduced based on actual water available. Are you aware that the SWP essentially had a two tiered water allocation based on M&I having paid substantially more for the SWP than did agric. The highly dubious and probably illegal non-public Monterey Agreement changed both of these clauses. Politics and money can undue the best of plans.
Thanks for the comment. Yes I am aware of the contract history. My proposal would allow SWP contractors to “retrade” Class 1 and Class 2 contract amounts so that they can decide on their preferred mix of priorities.