
On July 18, the State Water Resources Control Board adopted a drinking water standard for the regulation of the contaminant 1,2,3-Trichloropropane (TCP). The Division of Drinking Water set the standard for TCP at 5 parts per trillion (ppt) as a maximum contaminant level. If public water systems exceed the standard, they will be required to notify their customers and take corrective action. Based on recent actions taken by the City of Bakersfield to correct their TCP problems, the total tab for California’s public water systems will exceed $4 billion.
The man-made chemical is a recognized carcinogen that may cause cancer after long-term exposure. Said Felicia Marcus, chair of the State Water Board, “1,2,3-TCP is not naturally occurring and too many Californians have been exposed to it for far too long, which is why it has been our top priority for standard setting this year. . . . This standard will better protect public health and allow communities and the state to get on with the job of getting it out of our water supplies.”
The regulation will require more than 4,000 public water systems statewide begin quarterly sampling for TCP in their drinking water sources in January 2018. Systems will be in or out of compliance with the new drinking water standard based on the average of four quarters of sampling. If a water system’s four-quarter average is above the 5 ppt standard, it must publicly notify its customers of the violation and take corrective action to resolve the exceedance and avoid future violations of the standard. The Division of Drinking Water encourages systems with previous monitoring data indicating a high potential for future violations to begin taking corrective action prior to January 2018. The State Board expects that treatment by Granular Activated Carbon is the best available technology to address the TCP contamination.
The new standard was generally supported by the water industry. In its latest comments, the Association of California Water Agencies expressed support for the 5 ppt standard, although they recommended that water agencies be given a later deadline to meet the standard before being deemed out of compliance. https://www.acwa.com/wp-content/uploads/2017/07/123-TCP-ACWA-CA-NV-AWWA-Joint-Response-07142017.pdf
Where is the Groundwater Contamination?
TCP was historically used in industrial cleaning solvents and in soil fumigate pesticides. The chemical has been detected in water quality testing of groundwater throughout sixteen counties in California mostly in the Central Valley and Southern California (see table). A total of 562 water sources for 94 public water systems have had two or more reported detections during testing for the past 15 years. Sixty-two percent of the affected sources tested between 5 ppt and up to 50 ppt. Twenty-seven percent of the affected sources tested above 50 ppt and up to 500 ppt. Eleven percent of the affected sources tested above 500 ppt. Since tests conducted with old technology were incapable of detecting TCP at 5 ppt, testing regimens commenced in 2018 can be expected to yield higher instances of measured groundwater contamination than indicated in the table below.
Number of Affected Sources and Public Water Systems with Two or More Reported Detections of 1-2-3 TCP
| County | Number of Affected Sources | >5 – 50 ppt | >50 – 500 ppt | > 500 ppt | Number of Affected Public Water Systems |
| Butte | 1 | 1 | 0 | 0 | 1 |
| Fresno | 69 | 54 | 13 | 2 | 10 |
| Kern | 151 | 76 | 71 | 4 | 20 |
| Los Angeles | 155 | 95 | 19 | 41 | 15 |
| Madera | 1 | 1 | 0 | 0 | 1 |
| Merced | 26 | 7 | 12 | 7 | 11 |
| Monterey | 1 | 1 | 0 | 0 | 1 |
| Riverside | 22 | 20 | 2 | 0 | 4 |
| Sacramento | 2 | 1 | 1 | 0 | 2 |
| San Bernardino | 24 | 18 | 3 | 3 | 6 |
| San Diego | 13 | 7 | 4 | 2 | 1 |
| San Joaquin | 19 | 12 | 7 | 0 | 4 |
| San Mateo | 11 | 9 | 2 | 0 | 3 |
| Santa Cruz | 1 | 1 | 0 | 0 | 1 |
| Stanislaus | 17 | 9 | 8 | 0 | 5 |
| Tulare | 49 | 37 | 10 | 2 | 9 |
| Total | 562 | 349 | 152 | 61 | 94 |
Source: http://www.waterboards.ca.gov/drinking_water/certlic/drinkingwater/123TCP.shtml
City of Bakersfield Case Study
The City of Bakersfield approved last spring a project to treat 41 of the city’s 64 wells that exceed the 5 ppt maximum containment level. The capital investment totals $55 million. The annual operation and maintenance cost of treatment totals $5 million. To fund the capital investment, the city will spend $12 million from financial reserves and issue two revenue bonds for $42.4 million. Debt service and operations and maintenance costs will increase the city water rates by 16% in October 2017, another 13% in July 2018 and another 7.9% in July 2019.
What is the economic cost of Bakersfield’s treatment program? To answer this question, consider the life cycle cost of the treatment program. Life cycle costs include all recurring and one-time costs over the full life span of the project or a specified time period (i.e. “time horizon”). Costs include initial capital investment, annual operating costs and how they change over time and periodic capital replacements. In estimating Bakersfield’s life cycle costs, Hydrowonk uses the assumptions used in the city’s water rate study:
- Annual increase in capital investment: 3%
- Annual increase in operating costs: 2.3%
- System growth: 1.8%
The analysis considers three assumptions about the useful life of capital investment: 20 years, 30 years or 40 years. The analysis uses an interest rate of 5%.
For a 50-year horizon, the life cycle costs of Bakersfield treatment range from a low of $281 million for useful life of capital investment of 40 years to a high of $319 million for a useful life of capital investment of 20 years–see chart. (The life cycle cost is $286 million for a useful life of capital investment of 30 years).

The estimated life cycle cost assumes that future experience conforms with assumptions. Among the issues for risk assessment include (i) spread of contamination to wells currently not exceeding the 5 ppt maximum contaminant level, (ii) reliability of the chosen technology to reduce concentrations below 5 ppt, (iii) system growth, and (iv) future prices of capital replacement, operations and maintenance.
Costs to California’s Public Water Systems
The Bakersfield case study suggests that the life cycle costs for public water systems will exceed $4 billion. Here is Hydrowonk’s math:
- Bakersfield treated 41 of the 562 designated water sources, or 7.3% of the total.
- Life cycle costs at $295 million (the average of the three scenarios in the above chart)
- $4,049 million equals $295 million/7.3%
As with Bakersfield’s experience, public water systems throughout California will find that actual experience will differ from assumptions due to the risk factors identified above.
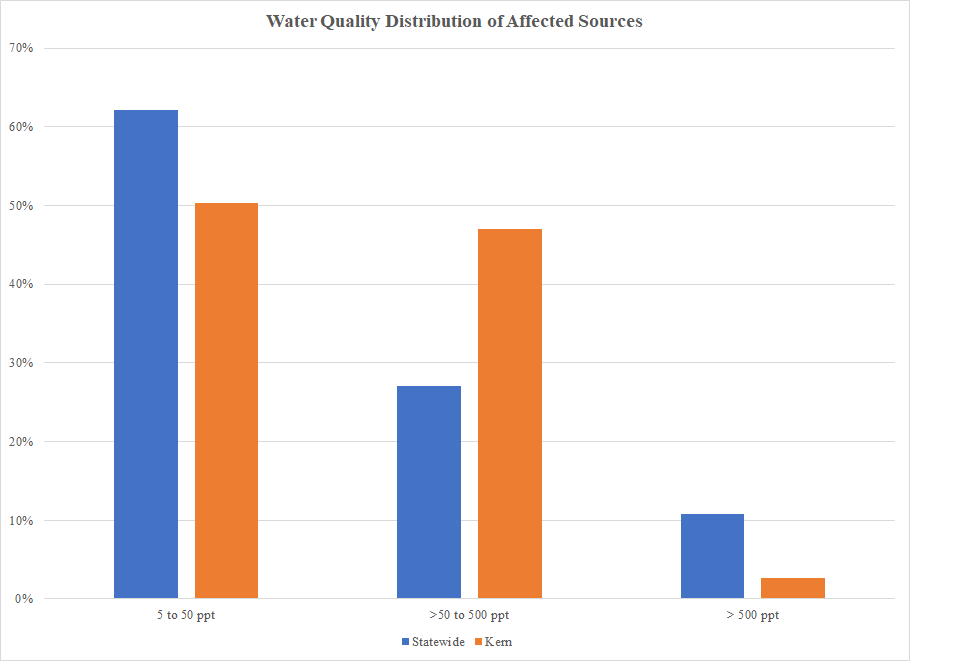
Two final caveats. First, the extent of the contamination problem may differ in California more generally than Bakersfield. As shown in the chart below, 62% of affected sources in California versus 50% of affected sources in Kern County have measured concentrations between 5 ppt and 50 ppt. Affected sources in Kern County have a higher incidence (47%) than affected sources in California (27%) with measured concentrations above 50 ppt to 500 ppt. Conversely, affected sources in Kern County have a lower incidence (3%) than affected sources in California (11%) with measured concentrations above 500 ppt. In comparison to California generally, the circumstances in Kern County fall more in the middle range (above 50 ppt to 500 ppt) and less in the lower range (5 ppt to 50 ppt) and high range (above 500 ppt).
Second, with more than 4,000 public water systems regularly testing for TCP after January 1, 2018, how many more water sources and water systems will have concentrations above the 5 ppt maximum contaminant level than found in historical testing? If the prevalence of TCP identified by the more sensitive detection tests expands the number of affected water sources significantly, California’s tab for addressing TCP contamination could become multiples of $4 billion.
How will public water systems pay for these costs? A subsequent post will discuss the alternatives: rate increases, litigation and grants.