Hydrowonk breaks down the COVID-19 Economic Recovery for each Colorado River Basin state. Channeling Rod Stewart, “every picture tells a story” regarding the context of the economies of each state in the Colorado River Basin.
Given the differences in the size of the Colorado River Basin states economies, economic losses from COVID-19 are measured as the difference between the pre-COVID-19 trend of real GDP and actual real GDP as a percentage of pre-COVID-19 trend of real GDP. Reflecting the availability of data from the Bureau of Economic Analysis, Department of Commerce, the time period for determining the pre-COVID-19 trend only extends back to 2018.
Arizona
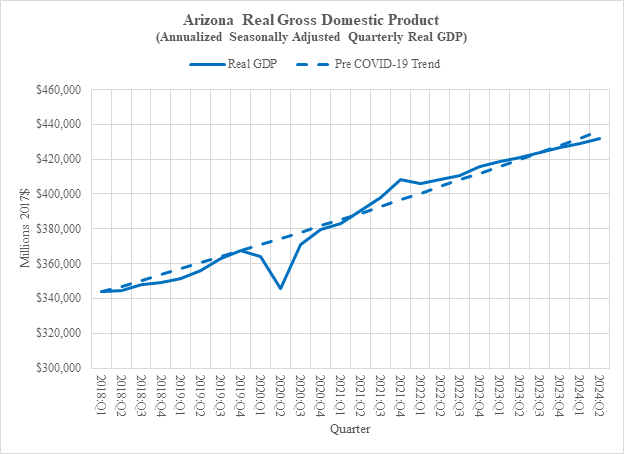
Arizona is the most resilient economy in the Colorado River Basin (see figure). Like the national economy, Arizona’s real GDP fell significantly (8.4%) in the 2nd quarter of 2020. The economic recovery in Arizona was so brisk that by the 2nd quarter of 2021 (only one year later) real GDP rebounded and even exceeded its pre-COVID-19 trend until the 3rd quarter of 2023. Future growth in Arizona and replacing lost Colorado River water will be a key future driver of the vitality of Arizona’s economic base.
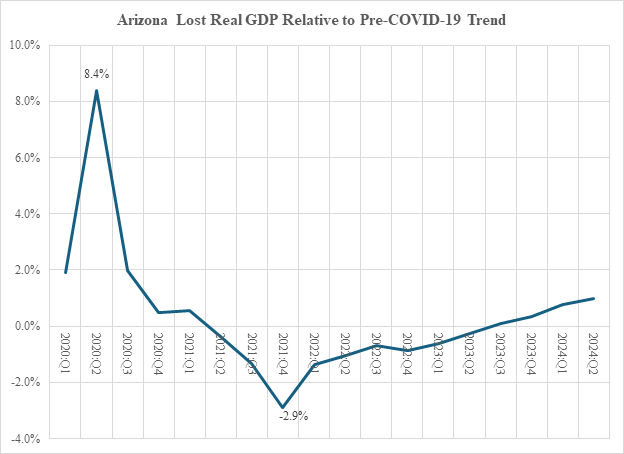
The figure below shows the quarterly loss of Arizona’s real GDP from COVID-19 as a percentage of pre-COVID-19 trend real GDP. By 4th quarter of 2021, Arizona’s real GDP was 2.9% higher than pre-COVID-19 trend of real GDP. Within a year and a half, Arizona’s real GDP returned to the pre-COVID-19 trend by the 2nd quarter of 2023 and fell below pre-COVID-19 trend real GDP. Are the Colorado River shortage declarations since 2022 having an impact on the Arizona economy?
California
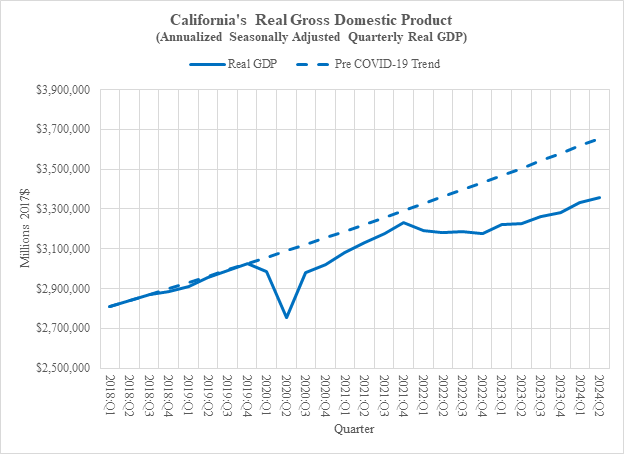
California is the laggard of the largest Colorado River Basin states (see figure). Like the national economy, California’s real GDP fell significantly (12.2%) in the 2nd quarter of 2020. The California economy rebounded marching towards the pre-COVID-19 trend of real GDP but hit a wall with the economic malaise of the national economy.
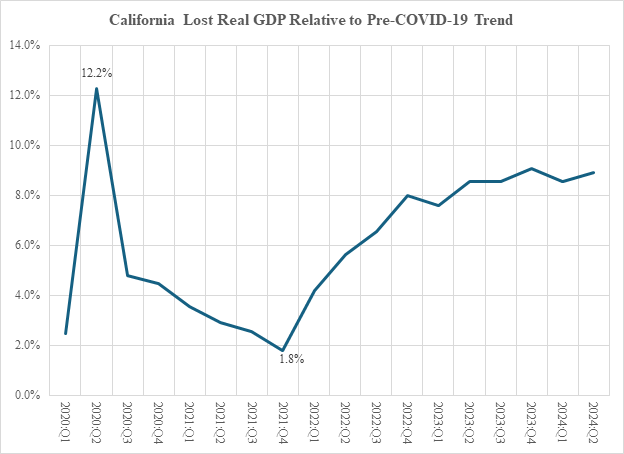
The figure below shows the quarterly loss of California’s real GDP from COVID-19 as a percentage of pre-COVID-19 trend real GDP. On the eve of the national economic malaise (4th quarter of 2021), California’s real GDP was only 1.8% below pre-COVID-19 trend real GDP. With the onslaught of the national economic malaise, California’s real GDP has become unhinged from its pre-COVID-19 trend. For the last five quarters, actual real GDP has been more than 8% below pre-COVID-19 trend real GDP. Is the notorious outmigration from California heralding a permanent stagnation of California’s future? Ask Elon Musk.
Colorado
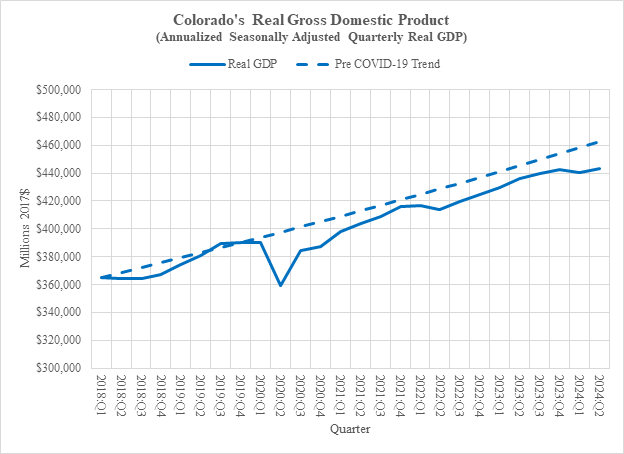
Colorado’s economy is more resilient than California’s (see figure). Like the national economy, Colorado’s real GDP fell significantly (10.6%) in the 2nd quarter of 2020. The Colorado economy rebounded marching towards the pre-COVID-19 trend real GDP but stalled a bit with the economic malaise of the national economy. Unlike California’s, Colorado’s real GDP moved in tandem, but still below, the pre-COVID-19 trend of real GDP.
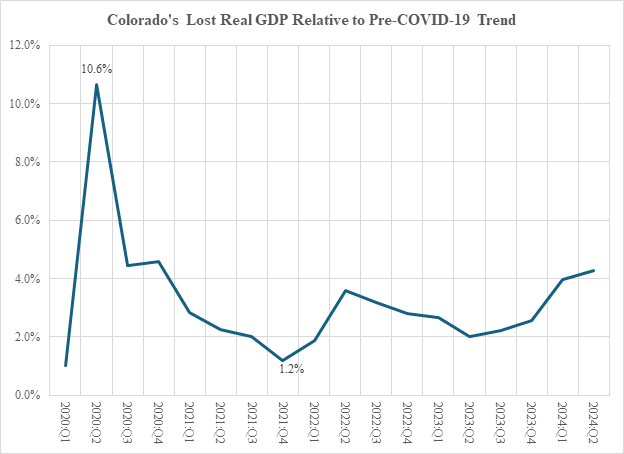
The figure below shows the quarterly loss of Colorado’s real GDP from COVID-19 as a percentage of pre-COVID-19 trend of real GDP. On the eve of the national economic malaise (4th quarter of 2021), Colorado’s real GDP was only 1.2% below pre-COVID 19 trend real GDP. With the onslaught of the national economic malaise, Colorado’s real GDP fluctuated between 2% and 4% below the pre-COVID-19 trend of real GDP.
Nevada
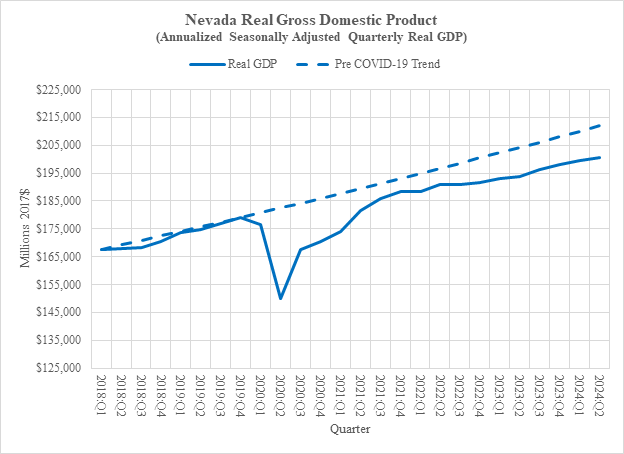
Nevada’s economy was especially hard hit by COVID-19 (see figure). Nevada’s real GDP fell significantly (21.7%) in the 2nd quarter of 2020. The Nevada economy rebounded marching towards the pre-COVID-19 trend real GDP but stalled with the economic malaise of the national economy.
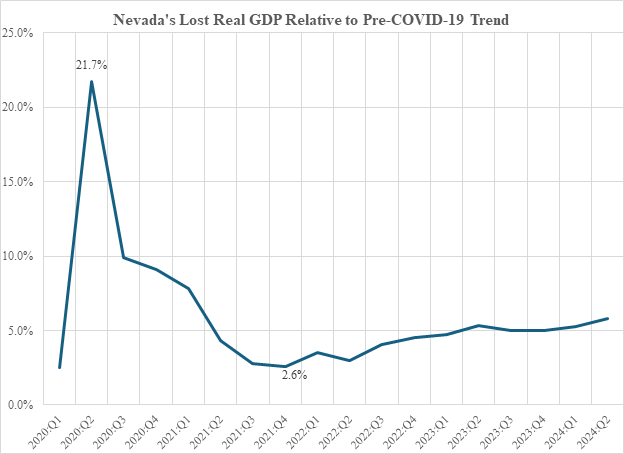
The figure below shows Nevada’s quarterly loss of real GDP from COVID-19 as a percentage of pre-COVID-19 trend of real GDP. On the eve of the national economic malaise (4th quarter of 2021), Nevada’s real GDP was 2.6% below pre-COVID 19 trend real GDP. With the onslaught of the national economic malaise, Nevada’s real GDP fluctuated around 5% below the pre-COVID-19 trend of real GDP.
New Mexico
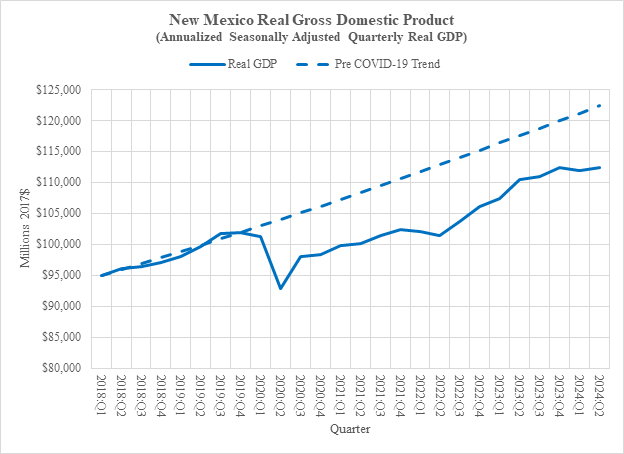
New Mexico’s economy was hard hit by COVID-19 (see figure). New Mexico’s real GDP fell significantly (12.1%) in the 2nd quarter of 2020. The New Mexico economy rebounded slowly marching towards the pre-COVID-19 trend real GDP but stalled with the economic malaise of the national economy. Since the onslaught of the national economic malaise, New Mexico’s real GDP is slowly creeping towards the pre-COVID-19 trend of real GDP.
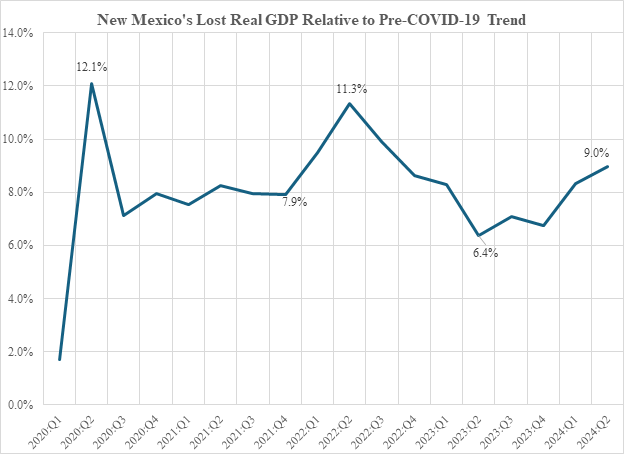
The figure below shows the quarterly loss of New Mexico’s real GDP from COVID-19 as a percentage of pre-COVID-19 trend of real GDP. On the eve of the national economic malaise (4th quarter of 2021), New Mexico’s real GDP was 7.9% below pre-COVID 19 trend real GDP. With the onslaught of the national economic malaise, the loss of New Mexico’s real GDP initially increased to 11.3% of pre-COVID-19 trend real GDP by the 2nd quarter of 2022, turned around and declined to 6.3% of pre-COVID-19 trend real GDP by the 2nd quarter of 2023, and turned around again and reached 9.0% by the 2nd quarter of 2024.
Utah
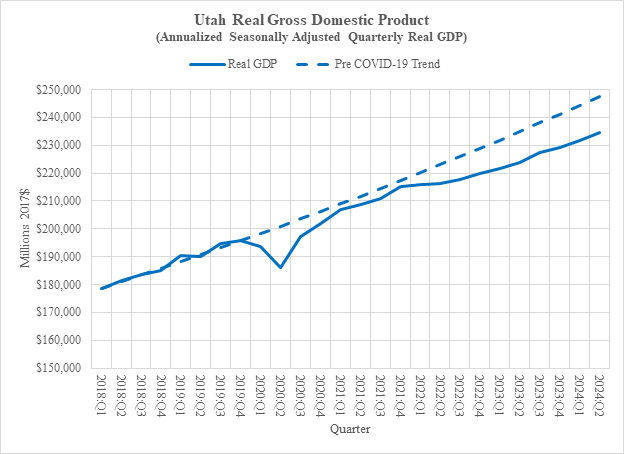
Utah’s real GDP fell significantly (7.9%) in the 2nd quarter of 2020 (see figure). The Utah economy rebounded towards the pre-COVID-19 trend real GDP but slowed down with the economic malaise of the national economy. Since the onslaught of the national economic malaise, Utah’s real GDP has been slowly falling behind the pre-COVID-19 trend of real GDP.
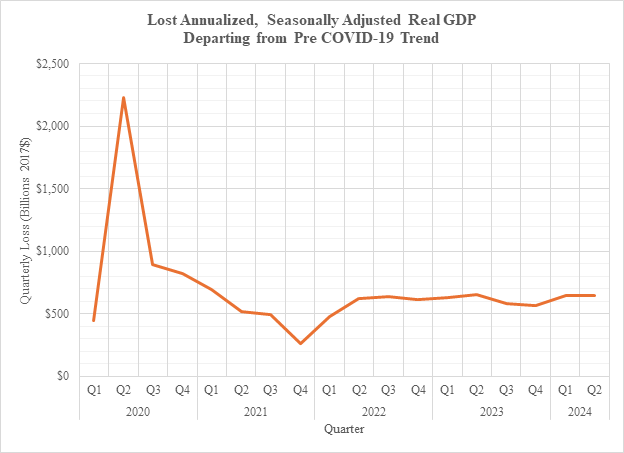
The figure below shows the quarterly loss of Utah’s real GDP from COVID-19 as a percentage of pre-COVID-19 trend of real GDP. On the eve of the national economic malaise (4th quarter of 2021), Utah’s real GDP was only 0.9% below pre-COVID 19 trend real GDP. With the onslaught of the national economic malaise, the loss of Utah’s real GDP initially increased to steadily reaching 5.5% by the 2nd quarter of 2024, slightly more than Colorado’s loss but significantly below California’s.
Wyoming
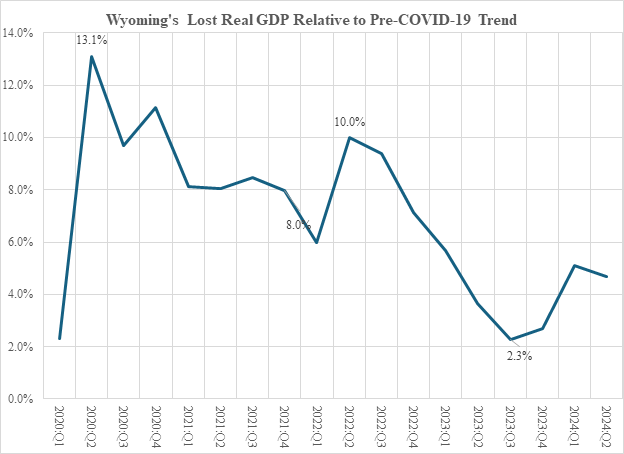
Wyoming’s real GDP fell significantly (13.1%) in the 2nd quarter of 2020 (see figure). The Wyoming economy rebounded towards the pre-COVID-19 trend real GDP but slowed down with the economic malaise of the national economy. Since the onslaught of the national economic malaise, Wyoming’s real GDP has been slowly but erratically increasing towards the pre-COVID-19 trend of real GDP.
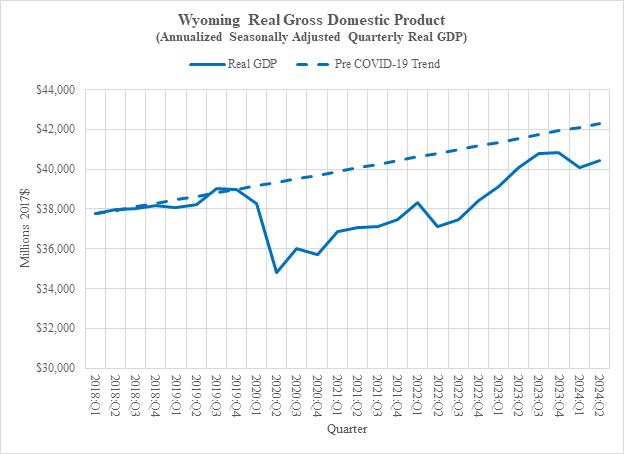
The figure below shows the quarterly loss of Wyoming’s real GDP from COVID-19 as a percentage of pre-COVID-19 trend of real GDP. On the eve of the national economic malaise (4th quarter of 2021), Wyoming’s real GDP was still 8.0% below pre-COVID 19 trend real GDP. With the onslaught of the national economic malaise, the loss of Wyoming’s real GDP initially increased to 10% but, from the 2nd quarter of 2022, declining until the 4th quarter of 2023 and reaching 5.5% by the 2nd quarter of 2024, slightly more than Colorado’s loss but significantly below California’s.
Final Thoughts
COVID-19 disrupted the economies of the United States, as well as the Colorado River Basin states. The economic dynamics within the Colorado River Basin going forward are different than they were a century ago. Addressing the over-appropriation of the Colorado River must look into the future while learning from the past.
