Almost five years ago, the US economy was on the verge of collapse. COVID-19 had crossed our borders, the economy was shutdown (although to a different extent among states) and many observers, including Hydrowonk, dusted off the history books on the 1930s Great Depression to create crystal balls about our country’s economic future.
What happened? How did the Colorado River Basin states cope? What does this mean for addressing the challenges of an over-appropriated Colorado River?
Hydrowonk lays out a framework for addressing the question in five parts:
- Part 1: The Nature of the National Economy Recovery
- Part 2: COVID-19 and the Economies of the Colorado River Basin States
- Part 3: Rethinking the Over-Appropriated Colorado River
- Part 4: The Evolution of the Bureau of Reclamation’s Role
- Part 5: Deconstructing the Impact of COVID-19 on Each Colorado River Basin State
Hint: (a) COVID-19 busted the historical narrative that future Lower Basin development is stronger than future Upper Basin development, (b) solutions must acknowledge the seniority of Indian water rights in the Colorado River Basin for broadening the geographic scope for new water investment/development opportunities, and (c) the shortage sharing provisions of the 1944 Treaty between Mexico and the United States can provide a catalyst for binational cooperation.
Visions of the Economic Impact of COVID-19
In February 2020, diversity of thought flourished about the impact of COVID-19 on the US economy. Some (such as the Trump Administration) envisioned a rapid “v-shaped” recovery where the severe shutdown of the economy would be followed by a rapid recovery. Others (such as Wall Street analysts) foresaw a “u-shaped” recovery where the economy would not reach its bottom for many quarters, if not years, followed by an extended and slow recovery. Hydrowonk’s meditations yielded a vision of a “tilted L” where the bottom would be reached rapidly with recovery delayed by disruption of supply chains requiring time to restore the economic relationships underlying our economy.
What Happened?
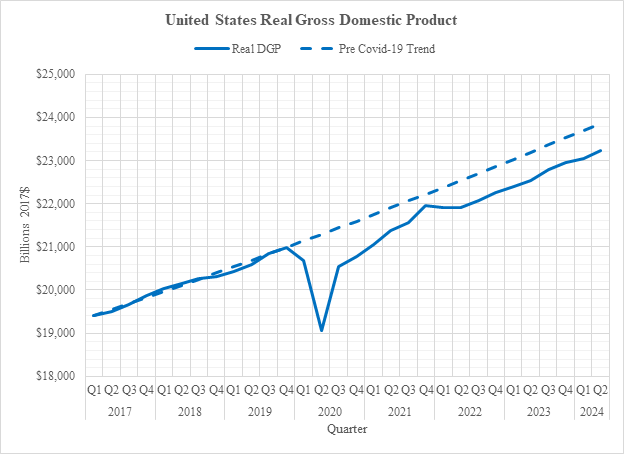
The US economy was expanding steadily during the first three years of the Trump administration. Real (inflation-adjusted) Gross Domestic Product “GDP” (value of goods and services produced in the United States) increased at an annual rate of 2.9% (see figure below of the annualized seasonally adjusted real GDP by quarter estimated by the Bureau of Economics, Department of Commerce).

The economic disruption started out looking “v-shaped” followed by a “tilted L”. Real annualized seasonally adjusted GDP stood at $21.0 trillion in the 4th Quarter of 2019 (the eve of COVID-19), bottomed out quickly at $19.1 trillion by the 2nd Quarter of 2020, and marched briskly back to $21.1 trillion by the 1st quarter of 2021 (all in 2017$). How long would the COVID-19 recovery take to restore pre-COVID-19 growth in the US economy? From the perspective of early 2021, Hydrowonk’s “tilted L” was missing. By 4th Quarter of 2021, real GDP reached $22.0 trillion, just short of $22.2 trillion of the pre COVID-19 trend.
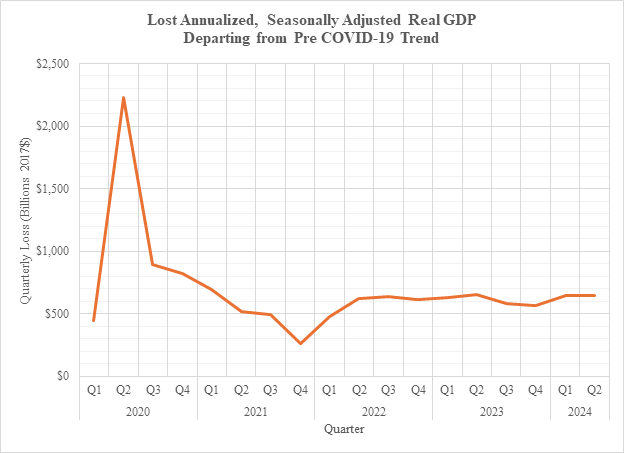
Economic malaise has overtaken the economy since the 4th quarter of 2021. Real DGP was flat for the first half of 2022. Since then, real GDP has remained stubbornly below the pre COVID-19 trend (evidence of a “tilted L”?). The lost real GDP departing from the pre COVID-19 trend (the dotted line less the solid line in the above figure) bottomed out at $260 million (2017$) in the 4th quarter of 2021 and then increased and fluctuated around $650 million (2017$) thereafter with no end in sight—see figure below.

Hydrowonk leaves it to economic historians to figure out the causes of the extended impact of COVID-19. Macro-economic, monetary and regulatory policies are “the normal suspects.” The role of disrupted supply chains may make a cameo appearance.
In Part 2, Hydrowonk shows the diverse impact of COVID-19 on Colorado River Basin States economies which provides the backdrop for Part 3’s discussion of rethinking the Over-Appropriated Colorado River.
