Call me skeptical. Ok, I say no.
The heralded conclusion that the BDCP generates net benefits of $5 billion for state and federal water contractors is not convincing. DWR understates costs. The benefits are summary statements about the findings of two economic models that are “black boxes”. Most importantly, the materials are silent on a simple but critical matter—did the calculation of present value of benefits take into account the decade delay between the necessary commitments to finance construction and the start of water deliveries.
Despite these reservations, DWR’s analysis offers valuable information on the economic value of avoiding water supply shortages. In my view, this is the best of BDCP materials. I unravel DWR’s statement of summary benefits (DWR does not separate municipal water user benefits from agricultural water user benefits). There three critical points:
- The benefit of municipal water users avoiding shortages is both substantial in its own right and much greater than the benefit of agricultural water users avoiding shortages.
- Given the distribution of water between agricultural and municipal water users under state and federal contracts, cost allocation discussions may be futile.
- If DWR did not take into account the decade delay between construction and initiation of water deliveries, the BDCP water conveyance project is UNDERWATER.
Where does this leave us? Back to water storage.
Economic Losses of Water Shortages
The mathematical equations in Chapter 9A may not communicate well for many. As I said in an earlier post, I’m a Ph.D. economist and know the jargon. The Brattle Group undertook a “herculean” (or is it “Augean stables”?) effort to organize and analyze the data underlying their approach. There is much to endorse.
From a reader’s perspective, the economic models are “black boxes”. After some math and narrative—presto! summary numbers. How much of the estimated benefits are for municipal water users versus agricultural water users? Not reported. I will shine some light on the architecture.
Given that DWR uses these tools to “justify” the multi-billion investment of the BDCP, they should think about how to distribute the critical material to transform black boxes into Lucite cubes. One also wonders about a formal public review of this critical material.
Economic Losses Municipal Water Users Suffer from Water Shortages
The economic loss per acre-foot of water shortage depends on the following factors (this is the approach taken by the Brattle Group):
- Retail water price—higher price, greater losses from shortages
- Incremental water cost (differs from retail price due to fixed costs of water systems)—higher incremental water cost, lower losses from shortages
- Elasticity of demand (measure of the responsiveness of water demand to water price)—more responsive demand is to price, lower losses from shortages
Using data from DWR’s appendix for Southern California, the economic loss of municipal water users increases rapidly with the size of water shortage (see chart below)

|
(Note to ecowonks—the underlying assumptions:
|
As always in economics, there are two cost concepts: average cost and marginal cost. Average cost expresses the economic losses of a defined shortage per AF of the water shortage. For a 5% shortage, for example, the economic loss expressed per acre-foot of the water shortage is $708 (2013$)/AF. The marginal cost expresses the increase in economic losses for an additional acre-foot of water shortages. For a 5% shortage, the economic losses from an additional acre-foot of water shortage is $812 (2013$)/AF.
Greater water shortages translate into higher average and marginal costs of shortages. Given the $875/AF retail price used in this example, the economic losses from water shortages are 100% to 300% of retail prices (compare marginal cost of shortages to retail price.)
There is a critical aspect about water shortage benefits of the BDCP. The BDCP does not increase supply reliability for state and federal contractors. Instead, the BDCP yields water in normal and wet years. Since the BDCP has no storage, the water shortages avoided will not be the “extreme ones” during critical years. Instead, the BDCP will avoid relatively moderate shortages. Therefore:
While the avoided economic costs of water shortages are substantial for the BDCP, the avoided economic cost of shortages from a reliable water supply would be much greater!
That is, the BDCP will avoid only moderate shortages (on the left hand side of the above figure). A reliable water supply would avoid those moderate shortages and the more extreme ones on the right hand side of the above figure.
Municipal Shortages and Low Yields from the State or Federal Water Projects
Shortfalls in a specific supply source do not translate “percentage-for-percentage” to water shortages. Consider the situation of Southern California (see table below). Annual total water use in the service area of the Metropolitan Water District is about 3.6 million acre-feet. Local water sources (groundwater, transfers and other sources) total 1.7 million acre-feet annually. The Metropolitan Water District of Southern California (“MWD”) accounts for the 1.9 million acre-foot balance. Of that amount, MWD’s water supplies from the Colorado River (4th priority right of less than 550,000 acre-feet per year and conserved water transfers from the Palo Verde Irrigation District and the Imperial Irrigation District) total 900,000 acre-feet per year. Water supplies from the State Water Project and withdrawals from storage account for the remaining 1 million acre-feet.
Total Water Demand and Supply Sources in Southern California
|
Item |
Amount (million acre-feet per year) |
| Total Water Demand |
3.6 |
| Local Supplies |
1.7 |
| Demand for Supplemental Supplies |
1.9 |
| MWD Colorado River Supplies |
0.9 |
| SWP Supply/Storage |
1.0 |
MWD has a Table A contract for 1.9 million acre feet of SWP water. A SWP yield of 52.6% will fill the current regional demand for supplemental water supplies. When SWP yield exceeds this threshold, MWD will store surplus water in its storage programs or conjunction use programs. If the SWP yield is less than the threshold, MWD will withdraw stored water to avoid water shortages.
The water shortages generated by the low SWP yields depends on storage policy. The table below shows the percentage water shortage, the size of the shortage, and the yield of the SWP project (assuming local supplies are firm and no water is withdrawn from storage). Currently, MWD has about 600,000 AF of water in storage programs and about 50,000 AF stored in conjunctive uses programs. When combined with drought storage in the Eastside Reservoir, MWD has about 800,000 AF of water in storage to offset potential water shortages. As take capacities are less than amount of water stored, as well as prudent storage policy, MWD cannot withdraw all water in storage in one-year. Assume they will take up to 200,000 AF (25% of stored water) in a shortage year.
Size of Water Shortage and Yield of State Water Project
for Southern California
|
Water Shortage (% Water Demand) |
Size of Shortage (million AF) |
Yield of State Water Project |
|
5% |
0.18 |
43.2% |
|
10% |
0.36 |
33.7% |
|
15% |
0.54 |
24.2% |
|
20% |
0.72 |
14.7% |
|
25% |
0.90 |
5.3% |
How water shortages work out in Southern California will depend on MWD’s storage policy. Will MWD draw down water in storage for small shortages when SWP yields are in the range of 30% to 40%. Alternatively, will MWD hold water in reserve to offset the potentially large shortages when SWP yields are at or below 20%? This is the type of critical but technical detail not shared by DWR’s study.
In my view (ok, guess), MWD will use its storage to offset the larger shortages (the highest marginal economic losses) and not offset smaller shortages (the lowest marginal economic loses.) If this assumption is correct, Southern California will probably not face shortages higher than 20%. When the SWP yield falls to 5%, MWD would withdraw about 200,000 AF from storage and limit water shortages in Southern California to 20%. MWD may “keep its powder dry” (so to speak) during smaller water shortages.
Economic Losses Agricultural Water Users Suffer from Water Shortages
DWR estimates the benefits of increased water supply from the BDCP for agricultural water users (outside the service areas of municipal water users) by using the Statewide Agricultural Production (“SWAP”) model developed by the University of California at Davis. DWR materials only share the mathematical structure of the model. The estimated benefits are part of the total (municipal and agricultural) benefits reported. The results are not broken out from the total. What to do?
|
ECOWONK ALERT! SWAP is a multi-product, multi-input model of profit maximization that accounts for both surface water and groundwater supplies. Remember micro-economic theory and Sheppard’s Lemma: the partial derivatives of the maximum value of a firm’s profit function yields the firm’s factor demand and supply equations. One can examine the profit impacts of a change in water conditions with use of the agricultural demand for surface water. We are back to the analytic formulation used for municipal water users. Now that I got that off my chest— |
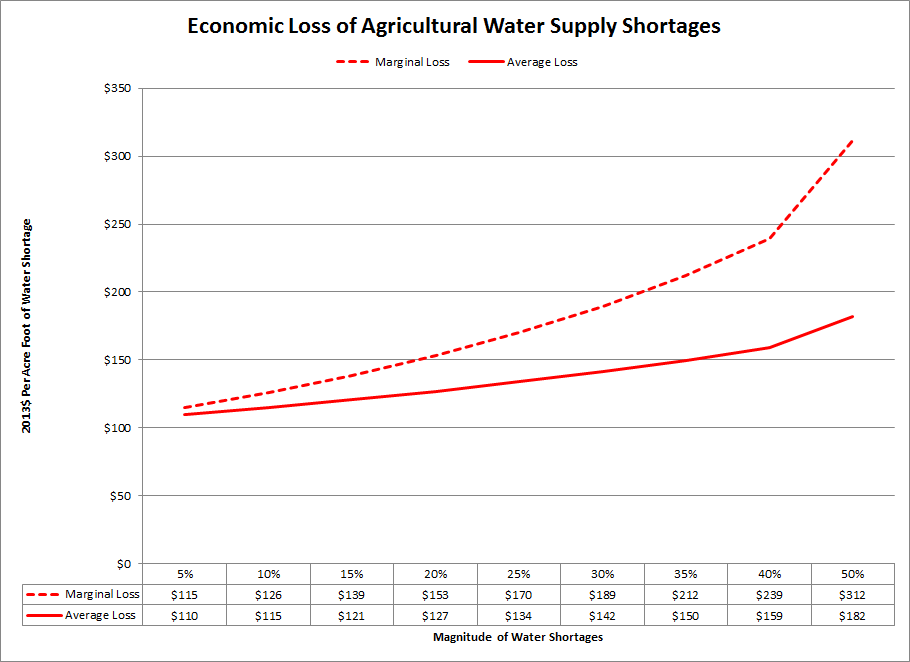
The economic loss agricultural water users suffers from water shortages also increases with the size of the water shortage, but at a much lower levels than municipal water users (see chart below). I extended the size of potential water shortages to 50%, to show that only in these extreme conditions would the marginal economic loss of a water shortage reach $300/AF (2013$). Of course, the analysis is for agriculture generally. Permanent crops, where investments exceed $20,000/acre may suffer economic losses greater than illustrated here.
|
(Note to ecowonks—the underlying assumptions:
|
The critical point is that agricultural water users economic benefit from avoided water shortages are a fraction of the benefit of municipal water users per acre-foot of shortage avoided. This difference in benefits will place pressure on cost allocation discussions.
Water and Cost Allocation
The DWR study assumes that the benefits of the BDCP for state and federal water contractors involve the expected economic value of water shortages avoided. I agree (but see discussion below about value of BDCP water in non-shortage years). Let’s see how a water and cost allocation process works. Since DWR did not report on the critical components of their analysis, I use the economic valuations stated above. I start with a discussion of annual valuations (see discussion below on present value) for SWP contractors.
What is the expected annual of the economic value of water shortages avoided per acre-foot of shortage? There are two components (back to stat class and Bayes theorem):
Expected Annual Economic Value = (Probability of Shortage) x (Average Value when shortages occur)
What are reasonable assumptions for these components?
- As stated in my earlier post Does the Bay Delta Conservation Plan Yield a Reliable Water Supply?, the probability of a shortage implicit in DWR’s analysis is in the range of 40% to 70% with the BDCP.
- For municipal water users, I assume that the average economic value of water shortage avoided is $1,000/AF (average shortage of 10%).
- For agricultural water users, I assume that average economic value of water shortage avoided is $150/AF (average shortage of 35%).
In making these assumptions, I’m assuming that municipal water users have greater water storage programs than agricultural water users. Given the extensive investments in storage by agricultural water users in Kern County, this assumption may be wrong—in which case I have overstated the economic value of water shortages avoided for agricultural water users.
State Water Project water is divided between municipal and agricultural contractors 70% and 30%. The table below shows the expected annual benefits of BDCP water from this water allocation by different assumptions about the annual probability of a shortage:
Expected Annual Benefit of Avoided Shortages by Probability and Water User (2013$)
| Annual Probability |
Expected Annual |
Benefit | Weighted Average |
|
Shortage |
Municipal |
Agricultural |
SWP Project |
|
40% |
$400 |
$60 |
$298 |
|
50% |
$500 |
$75 |
$373 |
|
60% |
$600 |
$90 |
$447 |
|
70% |
$700 |
$105 |
$522 |
Here are a couple of observations.
First, agricultural water users expected annual benefits from avoided shortages are less than $100/AF. With DWR stating that the cost of BDCP water is in the range of $200/AF to $300/AF, the BDCP project does not look like a viable alternative.
Second, municipal water users expected annual benefits from avoided shortages are in the range of $400/AF to $700/AF. If the cost of BDCP water is in the range of $200/AF to $300/AF, the BDCP project looks like a viable alternative.
Third, if the BDCP project yields lower pricing for agricultural water users to induce their participation, then municipal water users must extend material subsidies to agricultural water users (see table below).
Potential Cross Subsidization in BDCP Project
|
Annual |
Agricultural |
Subsidy |
Municipal |
Water Cost |
Municipal |
|
Probability |
BDCP Cost |
of Water |
BDCP Cost |
of Water |
Expected |
|
Shortage |
$200/AF |
$300/AF |
$200/AF |
$300/AF |
Benefit |
|
40% |
$140 |
$240 |
$260 |
$403 |
$400 |
|
50% |
$125 |
$225 |
$254 |
$396 |
$500 |
|
60% |
$110 |
$210 |
$247 |
$390 |
$600 |
|
70% |
$95 |
$195 |
$241 |
$384 |
$70 |
Fourth, assuming that the municipal water users do not want to subsidize the agricultural water users, then the BDCP project is a supplemental project for municipal water users.
Perhaps the most significant point is that the cost of BDCP water is NOT $200/AF to $300/AF. This DWR calculation ignores the economic implications of the decade delay between construction and the expected start of deliveries. Taking this into account and including the understatement of project costs, the annual cost of BDCP water is in the range of $625/AF to $890/AF, before consideration of the economic cost of debt coverage ratios.
The BDCP project is underwater
Ecowonk Alert: What happens to BDCP water during non-shortage years. Being a non-firm supply, BDCP water worth less than the economic value of avoided water shortages. Adding this into the valuation will not change the conclusion.
Present Value Perspective
The difference between DWR’s and Hydrowonk’s conclusion can be demonstrated in terms of present value (see table below). The top half of the table replicates DWR’s conclusion stated in Table 9-.A-2. The bottom half show the adjustments for timing of benefits and the understatement of capital costs.
Present Value of State and Federal Contractors Benefits
DWR Study v. Hydrowonk
|
Item |
High Outflow |
Low Outflow |
|
DWR |
||
| Benefits |
$18.011 |
$18.795 |
| Cost |
$13.328 |
$13.343 |
| Net Benefits |
$4.683 |
$5.452 |
|
Hydrowonk |
||
| Benefits* |
$13.402 |
$13.985 |
| Cost** |
$15.328 |
$15.343 |
| Net Benefit |
($1.926) |
($1.358) |
* adjusts for 10-year delay between firm capital commitments and start of delivery (74.4% ≈1/1.03^10 )
** adjusts for $2 billion understatement in capital costs
Conclusion
Despite the differences in conclusion, DWR’s study has demonstrated that avoiding water shortages has significant economic value. This dog does not hunt because the BDCP does not generate a reliable supply. While more water in normal and wet years will offset shortages facing California, the economic value of avoiding the moderate water shortages can’t support a $15 billion capital investment.
The takeaway here is that water storage must be center-stage in California’s investment program. For the state and federal projects, they have junior rights to surface water. For water users who need reliable water supplies, adding more non-firm water is not the answer. For someone who is a “supply reliability junkie”, adding non-firm water to the junior water rights of state and federal projects is like putting “lipstick on a pig.”
Instead, we must shift focus on transforming non-firm water supplies into more reliable water supplies. How? Storage. From this perspective, the BDCP focus on moving diversion points does help get around regulatory restrictions (witness the increased in average water supplies). By not including storage, the BDCP does not have the tools to address California’s pressing needs for reliable water supplies.
So, where does this leave us? California needs to add water storage to the mix. I see two alternatives:
(i) Add a storage component as part of the BDCP conveyance facility, or
(ii) Investment in new storage without a new conveyance facility
Under either case, I would look first at placing storage south of the Delta.
Why should one add a storage component to the BDCP? After all, Hydrowonk, you believe that the BDCP conveyance facility does not hunt. Consider three reasons:
(i) Increased water storage can tune up the reliability of pre-BDCP water supplies. As shown by DWR’s valuable analysis, the economic value of avoiding the most severe water shortages are substantial
(ii) The BDCP does increase the supply of non-firm supplies available for storage. With storage, these additional water supplies can address the most severe water shortages that the BDCP, in its current form, cannot avoid.
(iii) The added costs of storage would, within the realm of the BDCP or not, need not be great. To paraphrase my favorite former California mayor, “just a few billion more”
Do these ideas have merit?