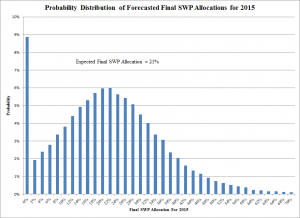
How does 21% sound, which would be a 40% increase over the current 15% allocation declared by the Department of Water Resources? While “more is better”, Californians cannot rejoice. Due to the natural variability in precipitation, there is a 9% chance that the final SWP Allocation may be zero!
No, Hydrowonk is not using an Ouija board. Instead, these forecasts are based on a study of the historic record of SWP final allocations. This year’s version is slightly different than the model used last year to forecast SWP Final Allocations for 2014.
Historical Record of Final SWP Allocations
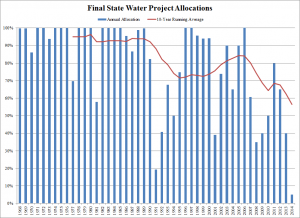
As I discussed last year, the history of SWP allocations has three distinct time periods (see Final State Water Project Allocations chart). From 1968 through 1989, SWP allocations averaged more than 90%. Spurred by the 1991 drought, SWP allocations dropped and averaged 74% through the 1990s. There was a brief recovery in SWP allocations, increasing by 10 percentage points until the early 2000s. Since then, average SWP allocations have been declining. Of course, last year was unprecedented. The SWP Final Allocation for 2014 was only 5% (most of the year the declared SWP Allocation was zero.)
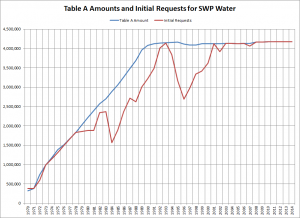
The period of 90%+ SWP Allocations corresponded with scheduled build-up of the SWP (see Table A Amounts and Initial Requests for SWP Water chart). SWP Contract Amounts grew until 1990. Therefore, the relevant historical period for thinking about SWP Allocations going forward is the post-1989 record. After the Monterey Amendments to SWP contracts, SWP contractors now request their full contract amount each year.
Model of SWP Final Allocations
Department of Water Resources looks at a variety of factors in setting SWP Allocations. Two key factors is the amount of water in storage at Oroville at the beginning of the water year (October 1) and forecasted and actual precipitation and runoff.
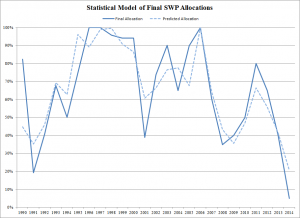
Hydrowonk conducted a statistical analysis of Final SWP Allocations between 1990 and 2014. The resulting model predicts about three-fourths of the annual variation in Final SWP Allocations (see Statistical Model of Final SWP Allocations chart). As expected, the Final SWP Allocation is greater, the more water in storage at Oroville at the beginning of the water year and the greater the actual amount of precipitation measured by the Northern Sierra 8 Station Precipitation Index, October through April of the water year. There was also a modest increasing trend in Final SWP Allocations of 0.8 of a percentage point per year from 1990 through 2002, that was reversed in 2003, Since then, the expected Final SWP Allocation is declining by 3.0 percentage points per year.
Conditions for 2015
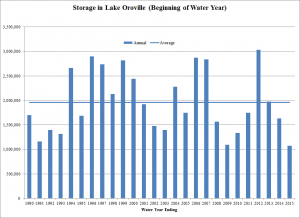
Start with bad news first. Water storage in Lake Oroville stood at 1,075,536 acre-feet on October 1, 2014 (start of the 2014-2015 water year). This is the lowest volume of water in storage for the 1990-2015 time period and substantially less than what was in storage at the beginning of the 2013-2014 water year (see Storage in Lake Oroville chart). With a final SWP Allocation of 5% in 2014 and meager water storage going into this water year, yikes!
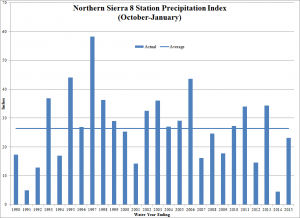
We all know that California has been recently blessed with precipitation by Mother Nature, especially in November and December. The Northern Sierra 8 Station Precipitation Index stands at 23.1 inches for October through January (see Northern Sierra 8 Station Precipitation chart). While a few inches below the 26.4 inch historical average, precipitation is six times the meager 4.5 inches of last water year.
Predictions for 2015
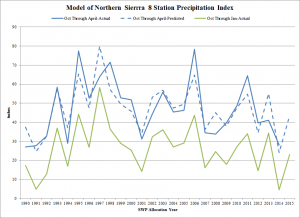
For Hydrowonk’s model, the only unknown factor (in addition to the underlying variability in the model’s predictions) is what, in fact, will be the cumulative precipitation for October through April. For 1990 through 2014, actual precipitation for October through April moves in tandem with actual precipitation for October through January (see Model of Northern Sierra 8 Station Precipitation Index chart). Knowing the actual precipitation from October through January, one can explain 72% of the variation in annual precipitation from October through April.
Models, of course, have underlying variability in their predictions (see the Probability Distribution of Forecasted SWP Final Allocations chart for 2015). The expected SWP Final Allocation for 2015 is 21%. The probability of a zero allocation is 9%. There is about a one-third chance that the final allocation will be below the current 15% allocation. On the flip side, there is about a two-thirds chance that the final allocation will be above the current 15% allocation.
Final Thoughts
There are two wild cards to keep one’s eye on as we wait for the Department of Water Resources determination of the Final SWP Allocation for 2015.
First, there is the fickleness of Mother Nature. Will precipitation be normal, above normal or below normal for February through April? Hydrowonk’s forecasts are based on an expected precipitation of about 20 inches for February through April, which is the average precipitation for those months. If precipitation proves to be 75% of the average, then my forecast of the Final SWP Allocation for 2015 would fall to 15%, the current allocation.
Channeling Clint Eastwood, do you think DWR will increase or reduce its final allocation? Well, do you think precipitation will be above or below average over the next three months?
Second, there are man-made actions. What will be the impact of environmental constraints on project operations? With the U.S. Supreme Court recent decision to pass on reviewing the federal appellate court decision on the 2008 biological opinion of the U.S. Fish and Wildlife Service, will the trend decline of 3 percentage points per year for the Final SWP Allocation adequately capture reduced allocations from regulatory constraints?
In the end, there is much uncertainty surrounding the outcome. The Journal of Water (www.JournalOfWater.com) will update the predictions monthly for actual precipitation in February through April.
Finally, you have your own insights. Express your opinion at the Stratecon Water Policy Marketplace (www.stratecon.inklingmarkets.com). Go to the question: “What will be California Department of Water Resources determination of the Final SWP Allocation for 2015?” There are three choices
- Increased Above Current Allocation of 15%
- Stay at Current Allocation of 15%
- Reduced below Current Allocation of 15%
Use the comment tools to share your reasoning, own predictions and insights.

